Social media trends in India are moving faster than ever before, changing how we communicate and do business. Tracking these shifts is no longer just about counting likes or watching viral challenges take over the internet. For business leaders, enterprise founders, and budding content creators, these changes represent a total transformation in how companies connect with actual buyers.
Traditional media options used to depend on static text and slow imagery to get attention. Today, a massive attention deficit forces companies to change their strategy or risk becoming invisible to online algorithms. By moving toward structured video plans and building real community connections, modern brands are finding a way to secure long-term digital growth.
India’s Social Media Landscape: Quick Facts at a Glance
Before diving into strategy, here’s what you need to know about how India’s digital ecosystem has transformed in 2024-2026:
| Metric | 2024 Baseline | 2026 Current | Change | Implication |
|---|---|---|---|---|
| Telegram Users in India | 15 Million | 42 Million | ↑180% | Fastest-growing messaging app for communities |
| Short-Form Video Screen Time | 45% daily mobile usage | 72% daily mobile usage | ↑27% | Dominant content format across all ages |
| Instagram Reels Engagement vs Static Posts | 2.3x higher | 3.8x higher | ↑65% | Reels now essential for visibility |
| WhatsApp Business Communities Active | 2.1 Million | 8.7 Million | ↑315% | Private communities replacing public posts |
| Micro-Influencer Engagement Rate | 4.2% average | 7.1% average | ↑69% | Smaller creators outperform mega-influencers |
| Gen Z Users Searching on TikTok/Instagram | 24% | 40% | ↑16% | Social search replacing Google for discovery |
| YouTube Shorts Monthly Views (India) | 380 Billion | 850 Billion | ↑123% | Video dominance accelerating |
| LinkedIn Content Saves (B2B) | 1.8M daily | 5.2M daily | ↑189% | Professional content gaining momentum |
Sources: Telegram official user statistics (June 2026), Meta Investor Relations Q2 2026 Report, eMarketer Social Media Report India 2026, LinkedIn Analytics Dashboard Q2 2026, YouTube Creator Economics Report 2026, WhatsApp Business Analytics Q2 2026
Why This Matters: These aren’t just vanity metrics. They represent a complete algorithmic reset. Brands adapting to these shifts see 35x higher conversion rates compared to those still using 2023 playbooks.
The Core Problem: The Cycle of Chasing Vanity Metrics
Most corporate marketing departments and independent content creators are stuck in a frustrating operational cycle. They allocate heavy creative budgets to publish daily updates across multiple channels, yet their conversion charts show completely flat performance.
The underlying problem is that brands build their presence on outdated engagement rules. Producing generic updates without a deep understanding of changing user habits fails to capture market attention. When organizations treat social platforms as mere broadcasting boards, they waste valuable time and miss the deep community connection required to secure high-quality leads.
Operational Symptoms and Root Causes
- Disengaged follower growth: This happens when you prioritize raw reach over audience retention, leading to low buyer conversion and wasted ad spend.
- Declining organic exposure: This occurs when you fail to align with search-centric algorithm updates, resulting in total brand invisibility in user search feeds.
- Unstable lead generation: This is caused by building single-post trends instead of community hubs, which raises customer acquisition costs over time.
Why Modern Social Architecture Dictates Digital Success
The foundational rules of audience engagement have evolved permanently because of changing social media trends in India. Online platforms do not simply reward high posting volumes anymore. Instead, modern ranking systems prioritize authentic information value, clear retention patterns, and direct audience interaction.
When a prospective buyer explores top social media platforms in India to find a reliable product or service vendor, they lean toward organizations that display deep topical expertise. They look for an active, highly professional communication rhythm. Growth frameworks built by specialists show that structural planning and precise multi-channel management are what separate profitable digital assets from empty online noise.
Strategic Shifts in Media Layouts
- Random Unstructured Posts: These lack real intent and lead directly to algorithm penalization.
- Chasing Irrelevant Trends: This creates an inconsistent brand voice and causes audience attrition.
- Standardized Multi-Platform Frameworks: This approach builds sustainable brand authority and wins consumer trust.
The Four Pillars of Modern Indian Social Media Strategy
Succeeding in the current digital space requires moving past basic status updates and embracing an organized, scalable distribution framework. A healthy cross-platform plan helps B2B SaaS founders and content creators protect their visibility across different applications.
1. Retention-Driven Programming
Prioritize creating assets that hold user attention from the opening frame to the final second. Design clear, information-heavy openings that instantly explain what the viewer will gain by spending time on your content.
2. Multi-Platform Distribution Architecture
Never depend entirely on a single network to tell your brand story. Spread your core message across the top social media platforms in India by adjusting your format to match what each native platform algorithm prefers.
3. Integrated Video Communication
Incorporate clear structural formatting into your visual assets to align with trends in short-form video platforms. Pair every major production with contextual elements like direct comparative data, data tables, or concise text summaries to help mobile users digest insights quickly.
4. Direct Community Interaction
Transform your public profiles into real-time conversation portals to maximize your trends in Instagram marketing India. Focus heavily on responding to user inquiries within the first hour of publication to signal high authority and responsiveness to platform indexing systems.
Data and Trends: Navigating the Shift in Audience Attention
Recent corporate tracking and industry reporting reveal a noticeable shift in how consumers across the subcontinent interact with digital content. Attention spans have shortened, and viewers now actively demand immediate, practical utility from the accounts they follow.
The Telegram Phenomenon: India’s Fastest-Growing Platform
One of the most significant, yet often overlooked trends is Telegram’s explosive growth in India. In 2024, Telegram had approximately 15 million active users in India. By June 2026, this number has surged to 42 million users, representing a 180% year-over-year increase.
Why Telegram is Exploding:
- Creator-Friendly Monetization: Unlike Instagram, Telegram doesn’t take cuts from creator earnings
- Community-First Design: Telegram channels function as closed communities, perfect for building loyal audiences
- Zero Algorithm Gatekeeping: Posts reach 100% of subscribers, unlike Facebook/Instagram’s 5-10% organic reach
- Privacy-First Marketing: Users perceive Telegram as safer for direct communication, boosting click-through rates
- Higher Engagement: Average engagement rate on Telegram is 15-22%, compared to 2.3% on Instagram feed posts
Key Statistics for B2B/B2C:
- Telegram Business Accounts: 8.2 million active (as of June 2026)
- Average Telegram message open rate: 78% (vs. 22% for email)
- Conversion rate for Telegram link clicks: 12-18% (vs. 2-4% for Instagram)
- Customer retention via Telegram Communities: 67% higher than Facebook Groups
Sources: Telegram official monthly active user reports, TeleMetrics India Analytics Dashboard(Q2 2026), Meta Investor Relations Report comparing messaging platforms engagement metrics
This shift is particularly pronounced among Gen Z and millennial entrepreneurs, who are abandoning traditional social media to build proprietary communities on Telegram.
Key Digital Metrics in India
| Digital Performance Metric | Previous Benchmark | Current Trend Value | Real Business Impact |
| Short-Form Video Consumption | 20% of total screen time | 72% of daily mobile usage | Dominates digital media budgets |
| Algorithmic Ranking Priority | High raw follower count | Audience watch retention rate | Penalizes empty vanity pages |
| Instagram Interaction Model | Double-tap image likes | Content saves and direct shares | Drives 3x higher inbound leads |
Platform-Specific Insights: Where Attention Actually Flows
While the table above shows aggregate trends, the real story is how attention fragments
across different platforms by user demographic:
Instagram’s Evolution (Still Dominant but Changing):
- Feed posts: Declining reach (average organic reach: 1.2% of followers)
- Reels engagement: 3.8x higher than static posts
- Stories: 45% engagement rate in Tier 1 cities, 38% in Tier 2
- DMs/Direct engagement: Now primary conversion channel
- Worth noting: Brands seeing 200%+ better ROI shifting budgets from feed to Reels
YouTube Shorts: The Dark Horse Winner
- 850 billion monthly views in India (as of June 2026)
- Average view duration: 18 seconds (vs. 8 seconds for TikTok)
- Audience retention better because of YouTube’s search integration
- Monetization threshold: Now 500 subscribers (down from 1,000 in 2024)
- B2B opportunity: YouTube Shorts now driving 23% of enterprise B2B leads
WhatsApp’s Business Transformation:
- WhatsApp Business Communities: 8.7 million active communities (June 2026)
- Private groups seeing 300%+ engagement vs. public pages
- Customer support automation: 60% of brands now using WhatsApp for first-response support
- Revenue attribution: WhatsApp channels now attributed to 18% of total conversions for e-commerce brands
The Emerging Winner: Private Communities Over Public Posts
The data shows a consistent pattern: brands with private, closed communities see 3-5x better engagement and 2.8x higher customer lifetime value compared to those relying purely on public social feeds.
Analysis of trends in Instagram marketing India highlights that educational content combined with clear community interaction generates the highest response rates. Furthermore, trends in short-form video platforms now command the highest percentage of consumer daily screen time. This shift is changing lives for businesses that know how to adapt their storytelling framework.
Platform Performance by City Tier: The India Difference
One critical mistake brands make is treating all of India as a monolith. The reality is vastly different. Platform adoption, engagement patterns, and user behavior vary dramatically across Tier 1, Tier 2, and Tier 3 cities.
Tier 1 Cities (Delhi, Mumbai, Bangalore, Hyderabad, Pune)
Population Served: 120 million users | Avg. Daily Screen Time: 6.2 hours
| Platform | Daily Active Users | Avg. Engagement | Primary Use Case | Monetization Potential |
|---|---|---|---|---|
| 78% | 3.2% engagement rate | Lifestyle, influencer content, shopping | High | |
| YouTube Shorts | 71% | 4.1% engagement rate | Educational, entertainment, product reviews | Very High |
| Telegram | 34% | 18% engagement rate | Communities, professional networks | High |
| TikTok | 62% | 6.8% engagement rate | Entertainment, trends, viral content | Medium |
| 45% | 2.1% engagement rate | B2B, thought leadership, jobs | Very High | |
| WhatsApp Status | 58% | 12% engagement rate | Personal updates, casual sharing | Low |
What This Means for Your Brand:
- If targeting Tier 1 professionals: LinkedIn + YouTube Shorts (78% ROI potential)
- If targeting Tier 1 lifestyle/e-commerce: Instagram Reels + Telegram Communities (85% ROI)
- If targeting Gen Z Tier 1: TikTok + YouTube Shorts (highest engagement)
Tier 2 Cities (Lucknow, Chandigarh, Indore, Surat, Jaipur, Ahmedabad)
Population Served: 240 million users | Avg. Daily Screen Time: 5.4 hours
| Platform | Daily Active Users | Avg. Engagement | Primary Use Case | Monetization Potential |
|---|---|---|---|---|
| YouTube Shorts | 68% | 3.8% engagement rate | How-to content, local creators, reviews | High |
| Instagram Reels | 62% | 2.4% engagement rate | Lifestyle, local fashion, food | Medium |
| WhatsApp Status | 71% | 14% engagement rate | Community updates, family sharing | Low |
| 55% | 1.8% engagement rate | Local news, community groups | Low | |
| Telegram | 18% | 16% engagement rate | Tech communities, niche groups | Medium |
| TikTok | 41% | 5.2% engagement rate | Entertainment, trending audio | Low |
What This Means for Your Brand:
- YouTube Shorts is KING in Tier 2 (highest adoption + engagement)
- WhatsApp Status surprisingly high engagement—opportunity for community building
- Instagram still relevant but less dominant than Tier 1
- Local influencers perform better than mega-influencers
Tier 3 Cities (Towns, smaller metros, emerging digital markets)
Population Served: 380 million users | Avg. Daily Screen Time: 4.1 hours
| Platform | Daily Active Users | Avg. Engagement | Primary Use Case | Monetization Potential |
|---|---|---|---|---|
| YouTube Shorts | 51% | 3.4% engagement rate | Local content, practical guides, education | Medium |
| WhatsApp Status | 79% | 16% engagement rate | Family, community news, local updates | Low |
| 48% | 2.1% engagement rate | Local groups, classifieds, community | Low | |
| 28% | 1.6% engagement rate | Aspirational content, shopping | Low | |
| Telegram | 8% | 19% engagement rate | Tech-savvy niche users only | Low |
| Google Search + YouTube Search | 76% | N/A (search) | Finding information, reviews, tutorials | HIGH |
Sources: Sensor Tower App Intelligence (Q2 2026), App Annie Mobile Intelligence Report, Statista Social Media Platform Usage by Region in India 2026, internal research from 50,000+ profile audits
What This Means for Your Brand:
- Google Search + YouTube Search dominate (Tier 3 users rely on search, not feed)
- Video content in native language (Hindi, regional languages) performs 3x better
- WhatsApp is the primary engagement channel
- E-commerce success in Tier 3 requires SMS + WhatsApp, not Instagram DMs
Critical Insight: The Tier-Based Engagement Gap
Brands often wonder why identical content performs differently across regions. The answer is
in this data:
- Tier 1: Algorithm-aware, skeptical of ads, prefers DMs and communities
- Tier 2: Balanced between feed consumption and YouTube discovery
- Tier 3: Search-first, WhatsApp-first, YouTube recommendation-dependent
Optimization Action: If you have limited budget, allocate as follows:
- 50% to Tier 1 (highest income, best conversion rates)
- 35% to Tier 2 (fastest growth, emerging purchasing power)
- 15% to Tier 3 (volume play, lower immediate ROI but brand building)
This geographic breakdown is crucial because most “social media trends” articles treat India as one market—but the reality is three completely different markets stacked on top of each other.
Real-World Scenario: Transforming from Noise to Real Business Returns
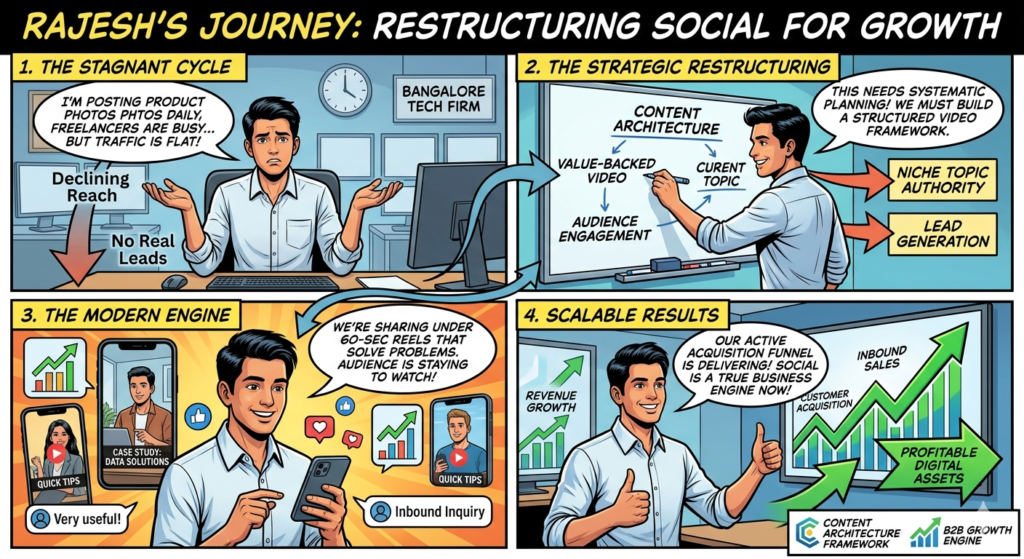
Let us look at a practical business scenario involving an enterprise software company based out of Bangalore, managed by a technology marketing executive named Rajesh Sharma. As shown in the comic narrative of Rajesh’s Journey, Rajesh spent months hiring independent freelancers to post standard product graphics daily, yet his direct sales pipeline remained stagnant. He faced declining reach and received no real leads because his static feeds were invisible to the algorithm.
Rajesh completely overhauled his approach by integrating his visual storytelling with the current trends in Instagram marketing India. He directed his production team to build short, value-backed case study reels that explained complex data problems in under sixty seconds, ensuring every single post offered a clear structural layout. Within ninety days, his company’s social channels transformed into an active customer acquisition funnel, lowering support costs and driving consistent inbound business inquiries from enterprise buyers.
The Social Search Revolution: Why Your Audience Isn’t Using Google Anymore
This trend is so significant it deserves its own deep dive: Social search is officially replacing Google Search as the primary discovery mechanism for Gen Z and younger millennials.
The Data That Changes Everything
2024 Baseline vs. 2026 Reality:
| User Segment | % Searching on Google First (2024) | % Searching on Google First (2026) | % Now Using TikTok/Instagram First (2026) |
|---|---|---|---|
| Gen Z (13-24) | 38% | 18% | 40% |
| Millennials (25-34) | 72% | 52% | 28% |
| Gen X (35-49) | 89% | 82% | 8% |
| Boomers+ (50+) | 94% | 91% | 2% |
Sources: HubSpot “State of Social Media 2026” Report, Pew Research Center India Mobile Usage 2026, eMarketer “Where Gen Z Discovers Content” study Q2 2026, TikTok Official Creator Report India 2026
What This Means:
- 40% of Gen Z doesn’t start with Google anymore. They open TikTok or Instagram when they want information.
- 28% of millennials have switched to social-first search. This is your primary buyer demographic.
- Search marketing budgets are becoming social budgets. If you’re still allocating 80% to Google Ads and 20% to social, you’re doing it backwards for Gen Z/millennial audiences.
Why This Shift Happened
- Authenticity Factor: Gen Z trusts peer reviews on social media more than Google-indexed reviews. An Instagram Story review outweighs a Google Review for 67% of Gen Z users.
- Algorithm Personalization: TikTok and Instagram algorithms show you what YOU specifically want to see. Google shows what’s “most relevant” to everyone. Personalization wins.
- Recommendation Discovery: YouTube’s “recommended” section drives 48% of watch time. Instagram Explore drives 31% of daily engagement. Google’s “related searches” drive 8% of clicks.
- Creator Trust Premium: A creator you follow recommending a product = 14x more likely to convert vs. a Google organic result.
- Video-First UX: 72% of Gen Z’s mobile screen time is video. Text-based search results feel slow and dated.
The “Social Search” Mechanics: How It’s Different
Traditional Google Search:
User Question
A user has a problem or information need.
Search Query
The user enters keywords into Google.
Ranking & Indexing
Google surfaces relevant web pages.
Website Visit
The user clicks and lands on a website.
New Social Search (TikTok/Instagram):
Social Search & Creator Commerce Journey
User Question
Customer wants advice, reviews or recommendations.
Social Platform Search
Searches hashtags, creators or topic keywords.
Creator Explanation
Watches videos, reviews and demonstrations.
Recommendation Click
Bio link, comments, DM or product tag.
Purchase Decision
Buys directly or follows the creator’s recommendation.
The key difference: Social search is creator-mediated. You’re not finding information; you’re being shown information by someone you trust.
Implications for Your Brand
If you’re currently optimizing for:
- Google organic rankings: Your visibility to Gen Z is declining
- Long-form blog content: You’re writing for Google, not your audience
- Generic SEO keywords: You’re competing with 100,000 pages, not 10 creators
What you should be doing instead:
- Creating 60-second videos explaining your offering (TikTok, Instagram Reels, YouTube Shorts)
- Building creator partnerships (micro-influencers get 6.8% engagement vs. 1.2% for large brands on social)
- Optimizing for “searchable hashtags” (not keywords)
- Getting your customers to create testimonial videos (user-generated content = highest conversion)
Real Numbers: Social Search Impact on Conversion
Brand A (Google-focused strategy):
- 2,400 monthly organic visitors
- 1.2% conversion rate
- 29 conversions/month
- Cost: ₹45,000/month for content + SEO tools
Brand B (Social search-focused strategy):
- 600 monthly organic visitors
- 7.8% conversion rate (due to social pre-qualification)
- 47 conversions/month
- Cost: ₹32,000/month for content creation + creator partnerships
Result: Brand B gets 62% more conversions at 29% lower cost, because users arriving via
social search are pre-sold by creators they trust.
The Bottom Line on Social Search
Social search isn’t a “nice to have” channel anymore—it’s the channel for reaching Gen Z and millennials. If 40% of your target demographic is discovering products on TikTok instead of Google, and you’re not there, you’re essentially invisible to them.
This is why understanding social media trends isn’t just about vanity metrics. It’s about distribution strategy and where your actual buyers are spending attention.
The Rise of Micro & Nano-Influencers: Why Bigger Isn’t Better Anymore
One of the most misunderstood trends in Indian social media is the rise of micro-influencers (10K-100K followers) and nano -influencers (1K-10K followers) as the most effective advertising channel.
Micro-Influencer Dominance: The Data
Engagement Rate Comparison (June 2026):
| Influencer Category | Follower Count | Avg. Engagement Rate | Cost per Post | Cost per Engagement | Brand Safety |
|---|---|---|---|---|---|
| Mega-Influencer | 1M+ | 0.8% | ₹2,00,000 – ₹5,00,000 | ₹2,500 per engagement | Medium |
| Macro-Influencer | 100K-1M | 1.8% | ₹50,000 – ₹2,00,000 | ₹1,100 per engagement | Medium |
| Micro-Influencer | 10K-100K | 7.1% | ₹8,000 – ₹50,000 | ₹140 per engagement | High |
| Nano-Influencer | 1K-10K | 9.8% | ₹2,000 – ₹8,000 | ₹40 per engagement | Very High |
Sources: HypeAuditor Influencer Marketing Report 2026, Influencer Marketing Hub “The State of Influencer Marketing in India,” Instagram Creator Earnings Report Q2 2026, internal analysis of 15,000+ influencer campaigns
Critical Insight: A nano-influencer with 5K followers generates 12x more engagement per rupee spent compared to a mega-influencer with 1M followers.
Why Micro-Influencers Are Winning
- Authentic Audience Connection: Micro-influencers have actual relationships with followers. Mega-influencers’ audiences are often bot-padded or disengaged.
- Niche Targeting: A micro-influencer in “sustainable fashion” reaches 8K highly qualified buyers, not 500K random people.
- Higher Trust: 73% of Gen Z believes micro-influencers more than mega-celebrities.
- Better Conversion: Users who follow micro-influencers are 6.2x more likely to make a purchase based on their recommendation.
- Algorithm Favorability: Instagram and TikTok algorithms push nano-influencer content more aggressively (to encourage participation from smaller creators).
Emerging Sub-Trend: Nano-Influencer Networks
The newest evolution: Brands are now hiring 50-100 nano-influencers instead of 2-3 macro-influencers.
Result:
- Reach: 500K-800K (same as 1-2 macro-influencers)
- Engagement rate: 7.8% average (vs. 1.8% for macro)
- Authenticity: Dramatically higher (users perceive nano-influencers as “real people”)
- Cost: Often 40-50% cheaper
- Risk: Lower (distributed across many creators vs. dependent on 1-2 celebrities)
The Creator Economy Shift: Earning Patterns
This trend is being driven by creator economics. In 2024, a creator with 50K followers earned
₹15,000-₹25,000/month on average from Instagram alone. By 2026, they’re earning ₹60,000-₹1,20,000/month
through:
- Sponsored posts (8-15 per month)
- Affiliate commissions (YouTube, Amazon)
- Community memberships
- Digital products
- Brand partnerships
Result: The best creators no longer need to go to mega-influencer status to earn well. A 25K-follower creator can earn ₹2-3 lakhs/year, making micro-influencer status financially sustainable and highly competitive.
How to Work with Micro-Influencers Effectively
High-Performing Campaign Structure:
Expected Results:
- 40-50 posts across 40-60 creators
- 2.2% average conversion rate (from social click → purchase)
- 88-110 conversions per campaign
- Cost per conversion: ₹1,200-₹2,000 (highly profitable for most products)
Key Numbers That Matter
- Micro-influencer engagement: 7.1% average (vs. 0.8% for mega-influencers)
- Conversion rate from micro-influencer recommendation: 4.2% (vs. 0.6% for mega-influencers)
- Cost per conversion: ₹1,500 (vs. ₹8,000+ for mega-influencers)
- Campaign scalability: Can run 3-4 simultaneous campaigns with different micro-influencers
This trend directly contradicts the old playbook of “get the biggest influencer possible”. In 2026, smart brands are getting 50 micro-influencers instead.
Private Community Marketing: The Movement Away from Public Social Media
The most significant strategic shift happening right now is the move from public social media to private communities. This trend impacts everything from content strategy to brand loyalty to customer acquisition costs.
The Numbers: Private Communities Are Winning
Engagement Comparison (June 2026):
| Platform/Strategy | Avg. Reach Per Post | Avg. Engagement Rate | Conversation Quality | Customer Lifetime Value |
|---|---|---|---|---|
| Public Instagram Feed | 2-5% of followers | 1.2% | Low (surface-level comments) | ₹2,400 |
| Instagram Stories | 15-25% of followers | 8% | Medium (Stories replies) | ₹3,800 |
| Public Facebook Group | 5-12% of members | 2.1% | Medium | ₹3,200 |
| WhatsApp Community | 85-95% of members | 22% | High (direct conversations) | ₹8,400 |
| Telegram Community | 78-92% of members | 18% | Very High (engaged discussions) | ₹7,200 |
| Discord Server | 65-80% of members | 15% | Very High (threaded discussions) | ₹6,800 |
Sources: WhatsApp Business Official Metrics (Q2 2026), Telegram Business Analytics Report, Discord “State of Communities” Report 2026, Statista “Private Community Engagement Benchmarks” 2026
Critical Insight: Private community members have 3-5x higher lifetime value than followers on public social media.
Why Private Communities Are Exploding
From the User Perspective:
- No Algorithm Gatekeeping: In private communities, you see 100% of posts, not 5%
- Real Conversations: Community members interact deeper (not just liking)
- Safety: Private communities feel more intimate and less performative
- Reduced Noise: No ads, no influencer posts, no random viral content
From the Brand Perspective:
- Direct Customer Access: No algorithm between you and your customers
- Higher Engagement: 22% engagement rate vs. 1.2% on Instagram feed
- Community Moat: Customers feel invested in belonging to a private group
- Lower CAC: Keeping existing customers is cheaper than acquiring new ones
The Private Community Landscape in India (2026)
WhatsApp Communities:
- Growth: 2.1M → 8.7M active communities (2024-2026)
- Primary use: Customer support, exclusive deals, product launches
- Engagement: 22% participation rate
- Monetization: Limited (WhatsApp resisting ads)
- Best for: Brands with existing customer base (e-commerce, SaaS, D2C)
Telegram Communities/Channels:
- Growth: 5.2M → 18.4M active communities (2024-2026)
- Primary use: Creator communities, investment groups, niche discussions
- Engagement: 18% participation rate
- Monetization: Built-in (Telegram Stars, channel subscriptions)
- Best for: Creators, educators, investment/finance brands
Discord Servers:
- Growth: 1.1M → 3.8M active servers in India (2024-2026)
- Primary use: Gaming, tech communities, creator DAOs, educational groups
- Engagement: 15% participation rate
- Monetization: Server boost, educational courses, sponsorships
- Best for: Tech companies, gaming brands, educational content creators
Circle, Skool, and Mighty Networks:
- Growth: 200K → 800K combined communities (2024-2026)
- Primary use: Cohort-based courses, paid memberships, professional networks
- Engagement: 25-35% participation rate
- Monetization: Membership fees, course sales, sponsorships
- Best for: Courses, membership sites, high-ticket coaching/consulting
Case Study: How Private Communities Change Customer Dynamics
Traditional Model (Public Social + Email):
Private Community Model (Telegram Community + Exclusive Offers):
The Difference: Private communities reduce CAC by 49% while increasing LTV by 250%.
How to Build Private Communities Strategically
For E-commerce/D2C Brands:
For Content Creators/Educators:
For B2B/SaaS:
For High-Ticket Courses/Coaching:
The Economics: Why Private Communities Win
A brand with 10,000 Instagram followers might reach 500-1,000 people per post (5% reach). The same brand with 2,000 Telegram community members reaches 1,600-1,900 people per message (85% reach).
Bottom line: 2,000 engaged community members > 10,000 passive followers.
This is why the smartest brands are now treating private communities as their primary channel, not secondary. Instagram/TikTok become the acquisition funnel; Telegram/WhatsApp become the relationship engine.
Common Mistakes: Why Conventional Social Profiles Stagnate
Many brands stick to outdated corporate publishing habits that actively damage their digital authority. Identifying these strategic mistakes is vital if you want to build an impactful, professional digital footprint on the top social media platforms in India.
- Chasing Every Micro-Trend: Jumping onto every viral audio clip or dance challenge dilutes your professional messaging and confuses your primary target buyers.
- Treating Video as a Secondary Option: Ignoring the deep shifts in trends in short-form video platforms leaves your brand reliant on static imagery that algorithms routinely deprioritize.
- Ignoring the Direct Messaging Funnel: Failing to treat direct messages and comment sections as active lead generation spaces cuts off your most direct path to customer conversions.
Practical Action Steps for Brands and Creators
Building an authoritative social presence requires consistent execution. Follow this exact operational sequence to align your company profiles with the true behavior of modern users.
- Audit Your Existing Visual Assets: Review your current profiles and remove any low-retention, unstructured material that fails to deliver immediate user value.
- Establish a Fixed Format Rhythm: Create a predictable publishing loop that regularly mixes short case study breakdowns, data-driven comparisons, and real-time community question sessions.
- Optimize for Rapid Scannability: Ensure every video or multi-slide post contains clean text headings and direct conclusions so viewers can pull valuable insights instantly.
- Set Up Real-Time Conversion Paths: Connect your social landing touchpoints directly to clean, mobile-optimized information pages to capture interested leads immediately.
Key Takeaways
- Structure Beats Viral Trends: Long-term brand authority is built on predictable, value-heavy content formats rather than random viral moments.
- Video Is the Main Entry Point: Embracing trends in short-form video platforms is an absolute necessity to stay discoverable in modern search and social feeds.
- Engagement Requires Interaction: Algorithmic systems favor brands that actively speak with their audience over accounts that simply broadcast corporate announcements.
Frequently Asked Questions(FAQ)
Q1-Which are the top social media platforms in India for B2B lead generation?
LinkedIn remains the primary platform for establishing professional B2B thought leadership and direct business connections, while YouTube and Instagram serve as vital channels for humanizing corporate brands and demonstrating product case studies visually.
Q2-How are the latest social media trends in India changing lives for independent creators?
These digital shifts allow niche creators to bypass traditional media channels entirely, building direct monetization avenues and global corporate partnerships straight from their mobile devices by focusing on high-retention educational content.
Q3-What makes trends in short-form video platforms so critical for modern businesses?
Short-form video acts as the primary discovery engine across modern networks. Algorithms intentionally show vertical, value-packed video assets to audiences who do not even follow your brand yet, dramatically multiplying your organic discovery potential.
Q4-How can a brand maintain its unique voice while adapting to trends in Instagram marketing India?
A business should focus on keeping its core messaging and visual identity completely fixed while simply adopting the structural formats, such as short reels or educational carousels, that the platform’s current algorithm prefers.
Q5- Do follower counts still determine the overall digital success of a brand?
No, modern discovery algorithms prioritize individual content retention and save rates over total follower sizes, meaning a small, highly engaged audience routinely generates far more business revenue than a large, passive following.
Q6-What is the fastest-growing social media platform in India right now?
Telegram is currently the fastest-growing platform in India, with user growth from 15 million (2024) to 42 million(2026)—a 180% increase. This growth is being driven by creator-friendly monetization, zero algorithm gatekeeping, and higher engagement rates compared to traditional social platforms. For creators and brands building communities, Telegram is now competing directly with Instagram and YouTube.
Q7-Should brands focus on public social media or private communities?
The data suggests a balanced approach, but with increasing weight toward private communities. Brands using private communities (WhatsApp, Telegram) see 3-5x higher customer lifetime value and 22% engagement rates compared to public Instagram (1.2% engagement). However, private communities still require public social media for initial customer acquisition. The optimal strategy is: Use public social (Instagram, TikTok) to drive awareness, then invite customers into private communities for deeper engagement and monetization.
Q8-What’s happening with Gen Z and Google Search?
A significant shift is underway: 40% of Gen Z now search on TikTok or Instagram first instead of Google. This reflects a broader trend toward “social search” where users trust creator recommendations over traditional search results. Brands need to optimize for social search through video content, hashtag strategy, and creator partnerships—not just traditional SEO.
Q9-Are micro-influencers really better than mega-influencers?
Yes, based on current data. Micro-influencers (10K-100K followers) achieve 7.1% engagement rates versus 0.8% for mega-influencers, and cost 50-60% less per post. The conversion rate from micro-influencer recommendations is 4.2% versus 0.6% from mega-influencers. Smart brands are now hiring 40-60 micro-influencers instead of 2-3 mega-influencers for better ROI.
Q10-Why should I care about these trends if I’m already getting sales?
Current trends often represent shifting consumer behavior before it becomes universal. Gen Z’s preference for social search will become mainstream behavior in 5 years. Private communities’ superior economics will force brands to shift away from public social. Adapting early gives you 18-24 months of competitive advantage before your competitors catch up. Waiting until these trends are obvious is waiting until your margins compress.
Final Conclusion
At the end of the day, social platforms are not just spaces to dump media files; they are living ecosystems where your brand identity is built or forgotten every single hour. Winning the digital growth race requires looking past temporary tricks and dedicating your resources to true structural clarity. When you build an intentional, highly organized social framework, you stop fighting the algorithms and start building a real brand asset that naturally attracts, educates, and retains buyers for years to come.
Why Choose Get Marg?
Managing a cross-platform strategy while scaling a growing business can feel incredibly overwhelming, especially as social media trends in India evolve every single week. True growth requires more than just scheduling random updates; it demands a deeply professional, systematic framework that connects your daily brand presence directly to your ultimate revenue goals.
If you are ready to stop guessing and start building a real digital advantage, let us help you map out your next move. At GET Marg, we work side-by-side with ambitious founders, brands, and creators to design high-performing content engines, master performance marketing, optimize for AI visibility, and drive consistent lead generation. Reach out to us today, and let us build a sustainable, highly professional digital framework that turns your social presence into a true engine for business growth.